One day, while reviewing AWS costs for a production account, I found a database bill that had stopped behaving like a database bill.
Amazon DocumentDB had historically cost roughly $250 per month (USD). Then the cost started climbing: first gradually, then to more than $3,000 per month.
The instance cost was almost flat. Storage was not the problem either. The new line on the bill was I/O.
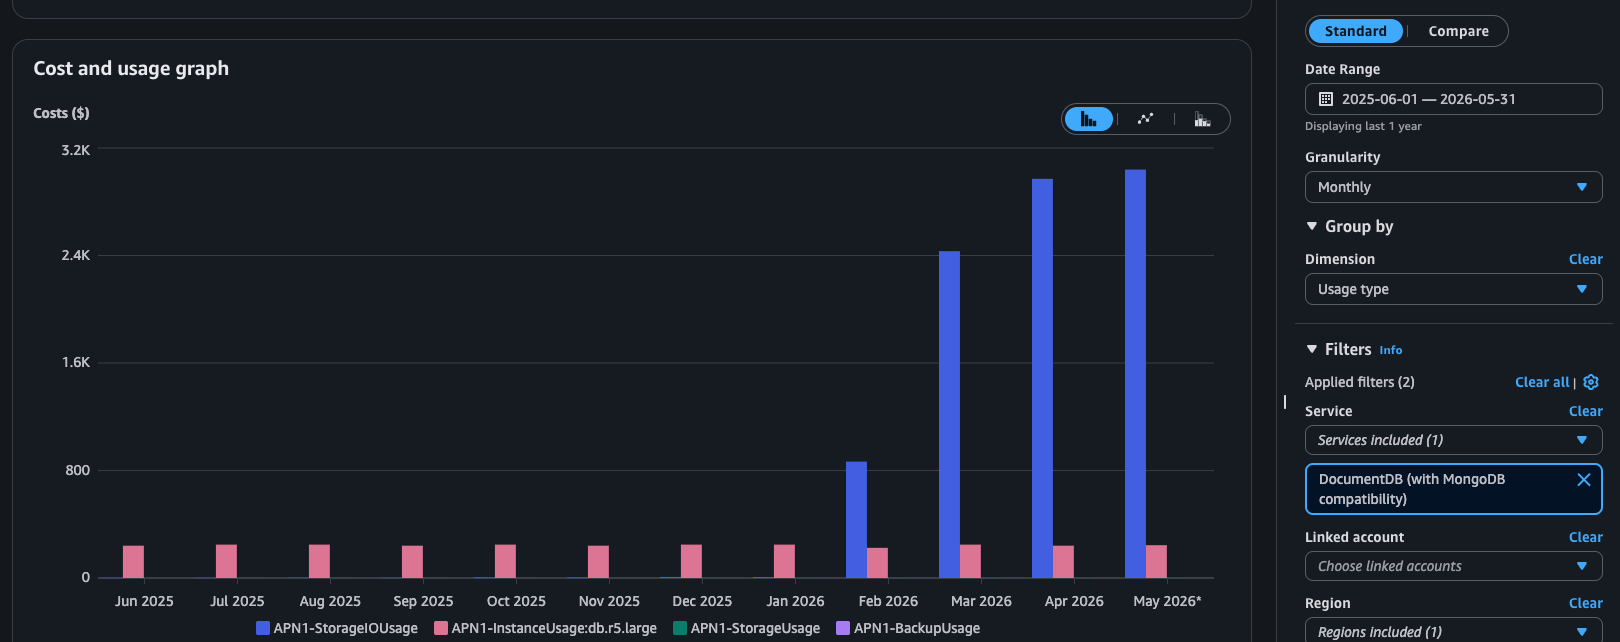
Write operations had not increased enough to explain it. Read activity, however, began rising around February and kept growing until the VolumeReadIOPs metric reached roughly 1.5 million operations per five-minute CloudWatch period in the six-month view.
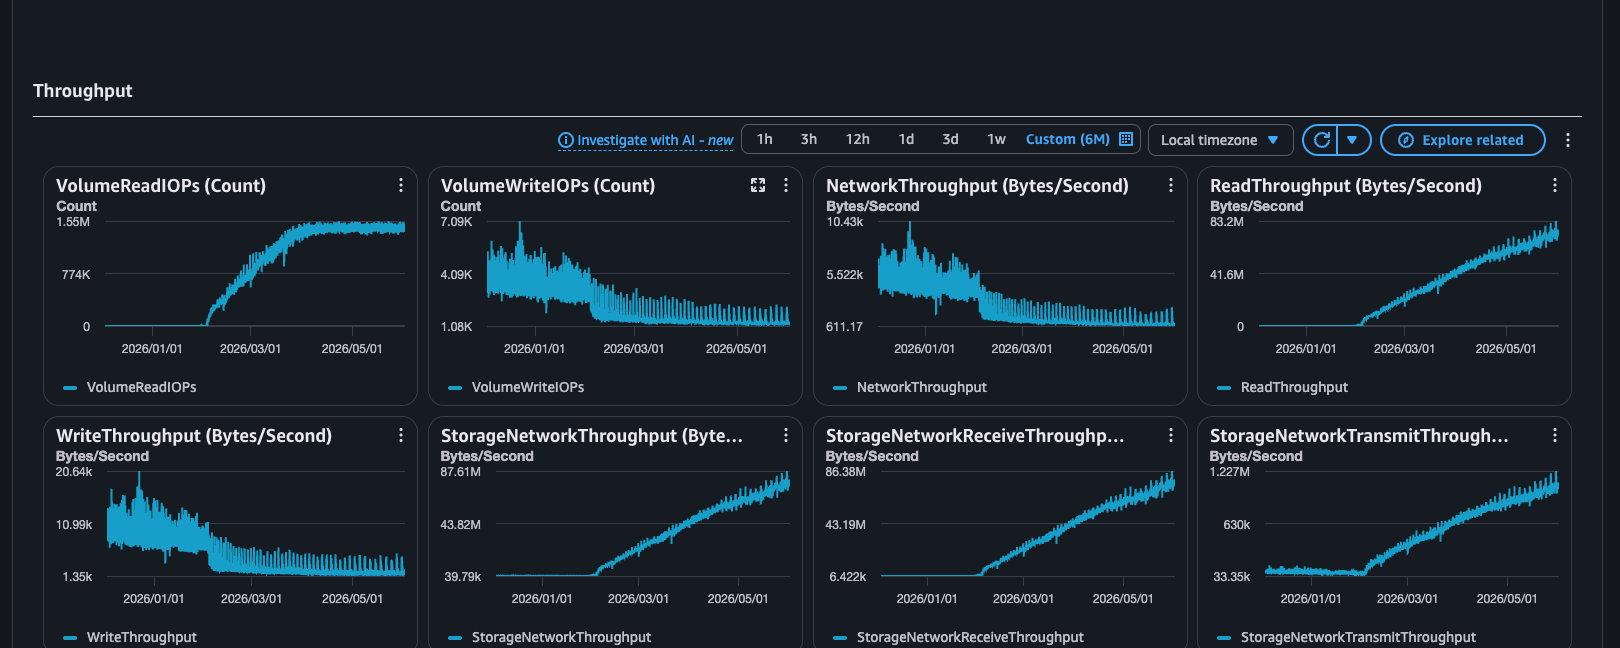
My first theory was reasonable: perhaps a reporting service, an analytics job, or another read-heavy process had launched around February.
I asked the team and searched deployment history and tickets. There was no obvious new workload from that period. Nothing I could point to and say, “There it is; optimize that service and we are done.”
The cost graph told me what was expensive, but not which operation was causing it. I needed evidence from the query plans.
Getting slow-operation evidence from production
I enabled the Amazon DocumentDB profiler with profiler_threshold_ms set to 100. The profiler records operations slower than the configured threshold in CloudWatch Logs, including their duration and plan summary.
This setting lives in a custom cluster parameter group. In this environment, attaching the new group required restarting the database instances. That made enabling a diagnostic tool a production change, with the same planning and rollback concerns as any other database maintenance.
The rollout was:
- Create a custom cluster parameter group, enable the profiler, and attach the group to the cluster.
- Add a replica and wait until it reported the new parameter group as synchronized.
- Promote that replica through a controlled failover. Existing connections experienced a few seconds of interruption while clients reconnected.
- Restart or replace the remaining instances so the whole cluster used the same configuration.
I chose the replica-first path so an instance could come online with the new configuration already applied before it became the writer. The interruption was then limited to the promotion and client reconnection window instead of the full time required to restart the current primary.
For this application, the short interruption was acceptable inside the maintenance window. If even that interruption were not acceptable, I would first design and rehearse a different migration path instead of improvising it in production.
Profiler thresholds also deserve care. A low threshold on a busy cluster can create load and a large volume of logs. AWS recommends beginning with a higher threshold and lowering it gradually when necessary. In this case, 100 ms was deliberate, monitored, and temporary. The profiler was there to answer a specific question, not to become permanent background noise.
After collecting a day of data, the slow-operation logs looked like this:
Names, document paths, identifiers, and timestamps below are representative and anonymized.
op: update (upsert)
filter: { "telemetry.device.id": "device-****", "telemetry.observedAt": "<timestamp>" }
millis: 145883
planSummary: COLLSCAN

op: update (upsert)
filter: { "telemetry.device.id": "device-****", "telemetry.observedAt": "<timestamp>" }
millis: 99522
planSummary: COLLSCAN

op: update (upsert)
filter: { "deviceId": "device-****", "observedAt": "<timestamp>" }
millis: 17155
planSummary: COLLSCAN

op: command (count)
filter: { "deviceId": "device-****", "observedAt": { "$gte": "<timestamp>", "$lt": "<timestamp>" } }
millis: 12369
planSummary: COLLSCAN
The longest upsert took almost 146 seconds. More importantly, every example ended with the same plan: COLLSCAN.
An upsert is a read before it is a write
upsert is one of my favorite database operations. It solves a wonderfully practical problem in one step: if the document exists, update it; if it does not, create it. That convenience was not the problem here.
The ingestion function performed one upsert per device, every minute. An upsert sounds like a write operation, but the database must first evaluate the filter to decide whether it should update an existing document or insert a new one.
Without an index that supports the filter, that decision requires scanning the collection.
The operational multiplier was simple:
number of devices × executions per minute × full collection scan = a lot of I/OAs the collection grew, each upsert had more documents to inspect. The application did not need a new reporting service to create a read explosion. Its existing write path was already generating reads, and the cost of each write was increasing with the size of the collection.
The implicit model had been: “This workload mostly writes, so it does not need indexes.” The profiler showed why that model was wrong. A write with a filter still needs an efficient way to find its target.
Index the filter, not the operation name
I mapped the recurring profiler filters back to their query shapes and proposed compound indexes aligned with the equality and range predicates. One representative index looked like this:
// telemetry_1m.samples
db.samples.createIndex(
  {
    deviceId: 1,
    observedAt: 1,
  },
  {
    name: "idx_samples_device_observed_at",
    background: true,
  }
);
The rest followed the same method:
| Collection | Predicate shape | Supporting index |
|---|---|---|
telemetry_30m.samples | telemetry.device.id equality + telemetry.observedAt equality | { "telemetry.device.id": 1, "telemetry.observedAt": 1 } |
telemetry_1m.samples | deviceId equality + observedAt equality/range | { deviceId: 1, observedAt: 1 } |
application.latest_samples | deviceId equality | { deviceId: 1 } |
application.change_history | accountId and changedField equality + changedAt range | { accountId: 1, changedField: 1, changedAt: 1 } |
These were background builds because the collections were active. That avoided blocking normal collection operations, but it did not make the work free: index construction consumes CPU, local storage, and read I/O. I monitored build progress and cluster headroom and treated the temporary spike as part of the change.
Before rollout, I also checked that each index matched the actual filter—not a remembered or simplified version of it. A field at telemetry.observedAt is not the same as one at the document root, and an index on the wrong path would have changed nothing.
The day the scans stopped
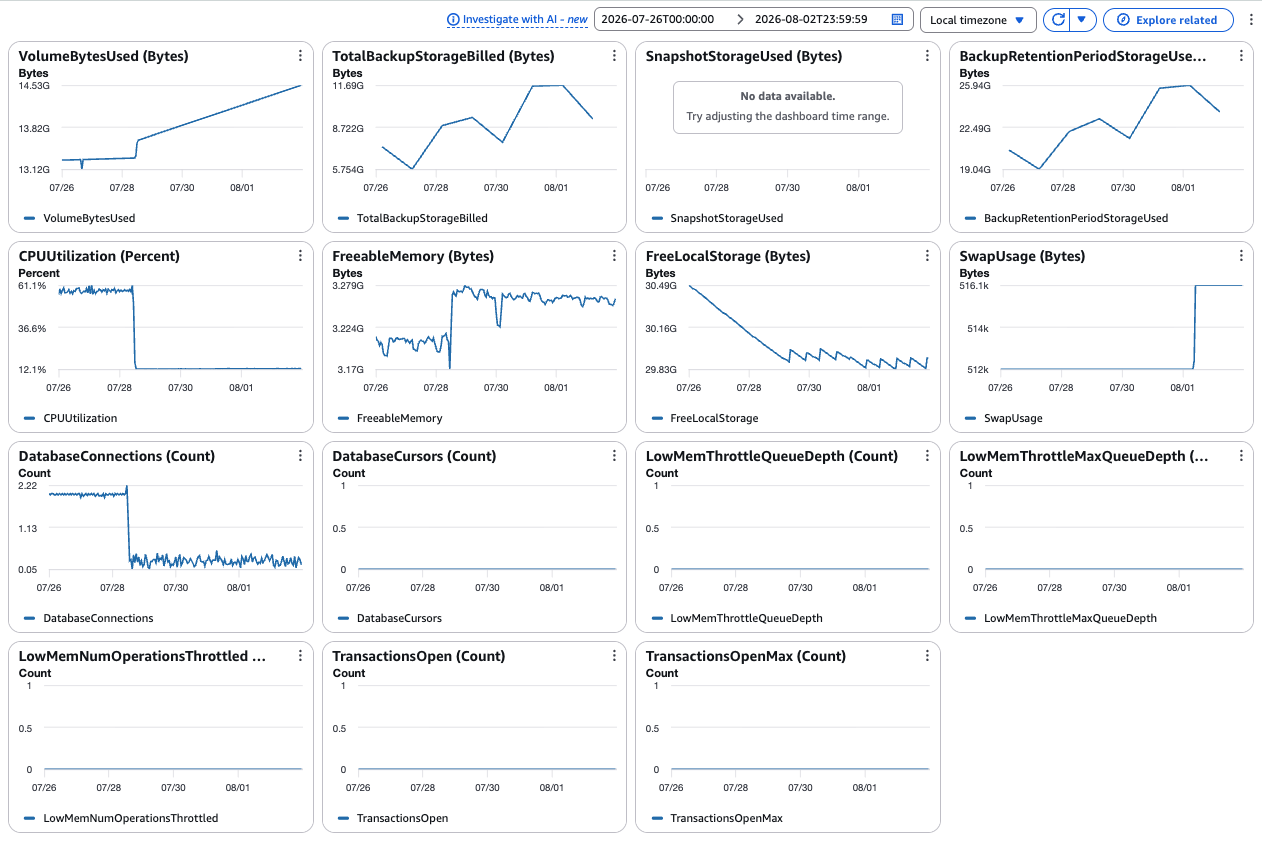
The indexes were built around July 28. A short spike in update activity, write throughput, and network traffic marks the change; immediately afterward, the expensive read path collapses:
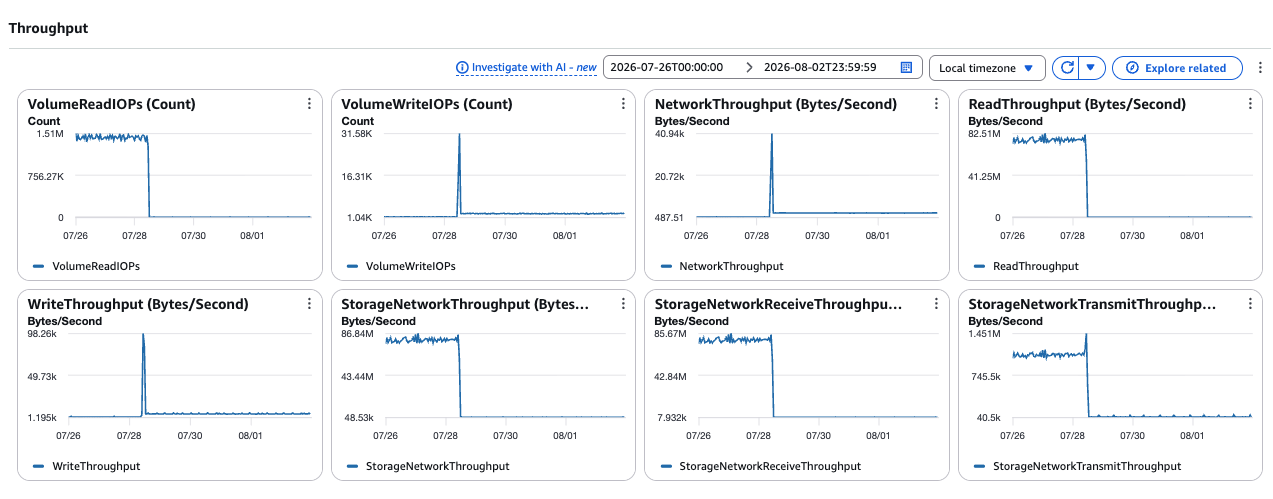
The profiler closed the loop: slow COLLSCAN entries for these query shapes stopped appearing after the indexes were available.
The dashboard’s aggregated read-latency metric moved from roughly 5 ms toward zero as the measured read volume almost disappeared. I would not interpret that as literal zero-latency reads; it mainly confirms that the scan-heavy read work was no longer occurring. Write latency improved from about 1.7 ms to approximately 1.1 ms.
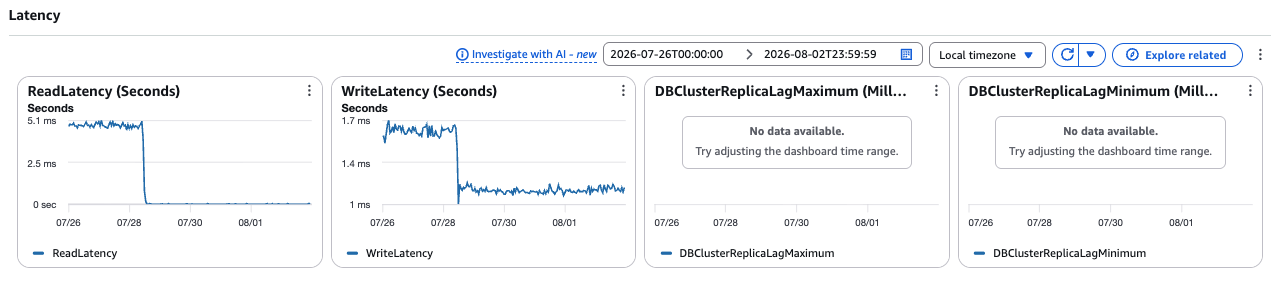
CPU utilization dropped from around 60% to around 12%. Freeable memory increased, database connections fell, and long garbage-collection activity almost disappeared—different views of the same work the database no longer had to perform.
The cost data followed the technical metrics. Before the change, one representative day cost about $82.13: $76.00 of storage I/O and $6.09 of instance usage. Afterward, a full representative day cost about $6.26: $0.12 of storage I/O and the same $6.09 of instance usage.
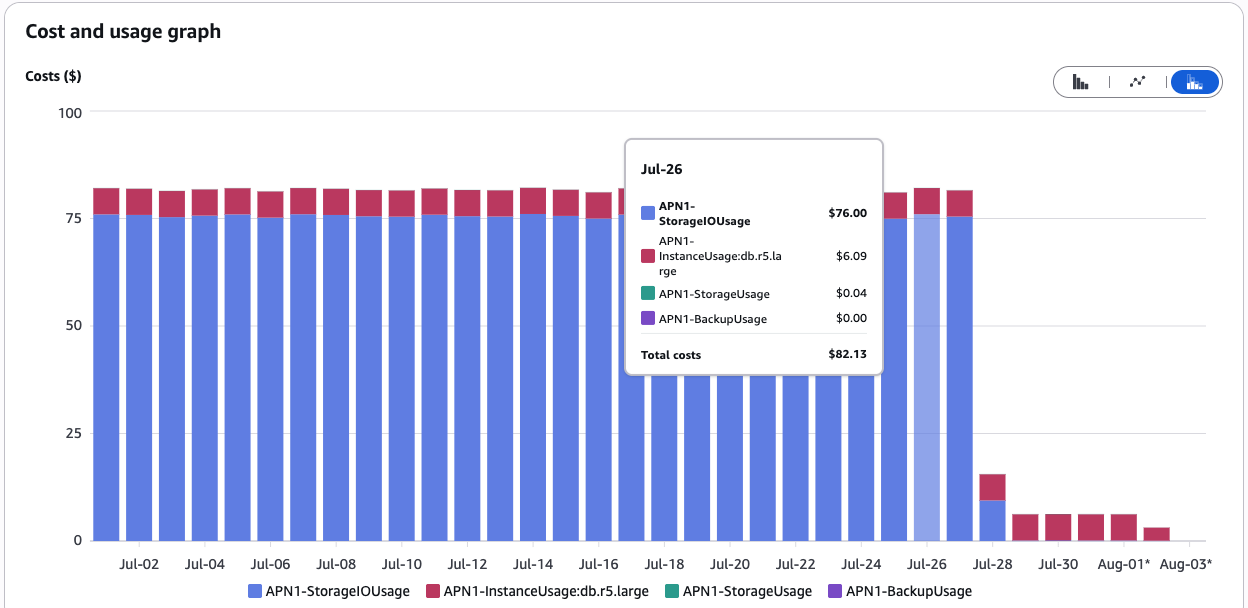
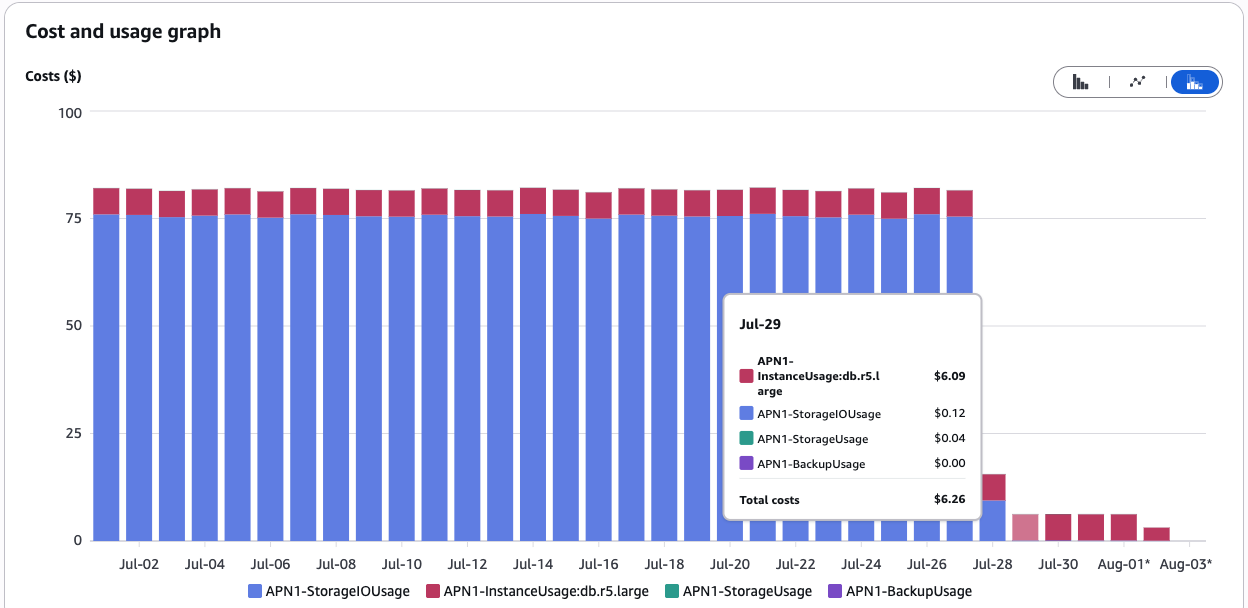
That is a reduction of more than 99.8% in the observed daily I/O charge and roughly 92% in the total daily database cost. I would wait for a complete billing cycle before calling it the final monthly saving, but the technical and cost signals remained stable for several days.
The ingestion functions also stopped timing out, and containerized services spent less time waiting for database calls. The same waste had been showing up as I/O charges, CPU pressure, long upserts, retries, and slow downstream services; cost was only one view of the problem.
The lessons I would carry forward are:
- Write-heavy does not mean read-cheap:
update,upsert, anddeletemust locate documents before changing them. - A stable request rate can become more expensive as a collection grows.
- Billing identifies the resource; query plans connect that cost to application behavior.
- Index design and rollout both need production evidence: real predicates, plan verification, capacity monitoring, and validation from the database through its callers.
The incident began with a surprising bill and no matching deployment. The eventual cause was quieter: an old write path, a growing collection, and no efficient way to find the document it wanted to update.
Every write had started by reading the whole collection.
Once that stopped, almost everything else got cheaper.
Practice diagnosing a missing index
The same habit—read the execution plan, match the index to the query, and verify the result—applies across database engines. Try the simulated MySQL composite index lab to work through a full table scan. It uses MySQL rather than DocumentDB, so the commands and index behavior differ; the shared lesson is to follow the query evidence.